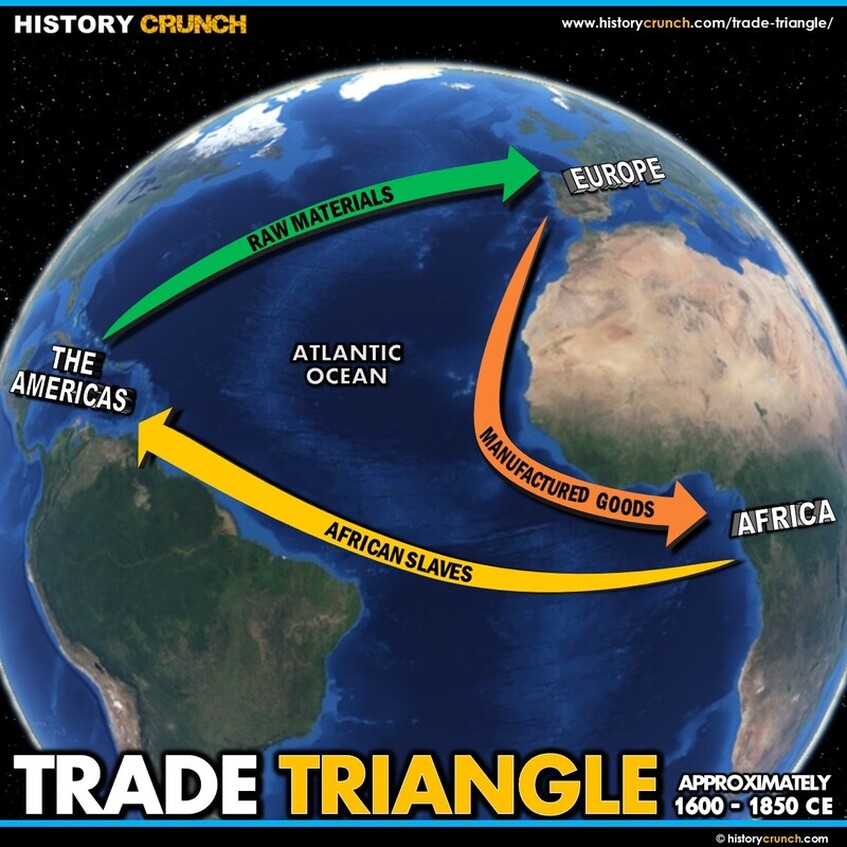
The Trade Triangle was one of the most significant and devastating trade systems in world history. Spanning from the 16th to the 19th century, it was a network of three interconnected routes across the Atlantic Ocean that connected Europe, West Africa and the Americas. At its core the Trade Triangle was the economic system that sustained the Atlantic Slave Trade, moving manufactured goods from Europe to Africa, enslaved people from Africa to the Americas along the notorious Middle Passage, and raw materials from the Americas back to Europe. Approximately 12 million Africans were transported across the Atlantic as part of this system. This map was created by History Crunch to help students visualize the three routes of the Trade Triangle and is based on the History Crunch articles on the Trade Triangle and the Middle Passage.
Trade Triangle Map
About This Map
This Trade Triangle map was created by the History Crunch team to help students and teachers understand the geographic routes and human consequences of the Atlantic trade system that sustained the slave trade for over three centuries. It is designed as a visual learning tool to accompany our full articles on the Trade Triangle and the Middle Passage. Teachers may use it as a classroom display, a geography activity, or a discussion starter about the human cost of the Atlantic Slave Trade and its lasting impact on the world.
What This Map Shows
The map shows the three main routes of the Trade Triangle forming a roughly triangular shape across the Atlantic Ocean connecting three continents: Europe, Africa and the Americas.
The first route shown on the map runs from Europe to the west coast of Africa. Along this route, European traders transported manufactured goods including metal tools, textiles, beads and other items to trading posts and ports along the West African coastline. These goods were exchanged with African societies for enslaved people. It is important to note that African societies along the western coast played an active role in this trade, with some communities capturing and enslaving people from the interior of the continent and selling or trading them to European merchants at coastal ports.
The second and most infamous route shown on the map is the Middle Passage, which ran from the west coast of Africa across the Atlantic Ocean to the Americas. This was the route along which enslaved Africans were transported to the New World aboard European slave ships. The journey across the Atlantic took up to six months in the 16th century and the conditions aboard the ships were horrific. Enslaved people were packed into the holds of ships with minimal space, food, water or sanitation. Disease was rampant and death rates during the crossing were extremely high. Approximately 12 million Africans were put on slave ships during the centuries of the Atlantic Slave Trade, though a significant number died during the Middle Passage before ever reaching the Americas.
The third route shown on the map runs from the Americas back to Europe. Along this route, European traders transported raw materials harvested by enslaved workers on plantations in the Americas back to European factories and markets. The most significant of these raw materials included sugar, cotton, coffee, tobacco and metals. These goods were processed in European factories and the profits generated funded further voyages, perpetuating the cycle.
The map illustrates how the three routes formed a continuous cycle of exploitation that enriched European nations and plantation owners at an enormous human cost to the people of Africa. Of the approximately 12 million Africans transported as part of the Atlantic Slave Trade, around 600,000 were brought to the United States, representing approximately 5 percent of the total. The vast majority were transported to the Caribbean and South America.
How to Use This Map in the Classroom
This map works well as a visual introduction to the Trade Triangle and the Atlantic Slave Trade before students read the full articles. It can be used as a geography activity asking students to trace each of the three routes and identify the regions of Europe, Africa and the Americas involved in the trade. Teachers may also use it as a discussion prompt asking students to consider how the three routes of the Trade Triangle were connected and why the system was so profitable for European nations despite being so devastating for the people of Africa. It pairs well with articles on slavery in the United States, the Middle Passage and the Columbian Exchange to help students understand the broader context of Atlantic trade during the Age of Exploration.
Related Articles
To learn more about the topics covered in this map, visit the following History Crunch articles: